ISSN: 2313-2868
Rev.peru.cienc.act.fis.deporte
Influencia de la fuerza en la velocidad máxima de un partido de fútbol en diferentes estados de madurez
Influence of strength on the maximum speed of a soccer match in different maturity status.
Hespanhol, Jefferson Eduardo1; Lopes Pignataro Silva, Rodrigo1; Lopes Hespanhol de Goes, Tamayka1; Pereira de Góes Netto, João1; Arruda, Miguel1
1Universidade Estadual de Campinas, Faculdade de Educação Física, Campinas, São Paulo, Brasil.
Original
Resumen
Objetivo: Verificar la influencia de la fuerza en la velocidad máxima de un partido de fútbol en diferentes estados de madurez.
Métodos: 175 jugadores de fútbol masculinos divididos en tres grupos de maduración con respecto a la clasificación de PHV: 42 fueron Pre; 57 durante y 76 post. Las pruebas utilizadas fueron: a) la medición de la velocidad máxima de movimiento durante el juego; b) prueba de salto vertical: salto en cuclillas, contramovimiento, salto en caída y salto continuo, c) prueba de salto vertical en sentadilla con evaluación de la producción de fuerza: isométrica, excéntrica, concéntrica y estabilidad.
Resultados: el análisis multivariado de las asociaciones de los parámetros de producción y las manifestaciones de fuerza con la velocidad máxima del juego mostró que había diferentes asociaciones en cuanto a los grupos de maduración, que fueron: el grupo pre-PHV tenía una asociación moderada entre velocidad y fuerza (R2 = 40.48%, p <0,05); en el grupo durante PHV estuvo con asociación pequeña, pero no significativa (R2 = 17.25%, p> 0.05); y para el grupo posterior al PHV se encontraron altas asociaciones entre los desempeños (R2 = 71.40%, p <0.05).
Conclusiones: Si bien la velocidad máxima puede verse influenciada por el rendimiento de la fuerza antes y después del pico, no hay influencia en el grupo durante el PHV.
Palabras clave: estado de madurez; velocidad pico de altura, desarrollo; fuerza y velocidad; Jóvenes futbolistas.
Abstract
Objective: The objective of this study was to verify the influence of strength on the maximum speed of a soccer match in different maturity status.
Methods: 175 male soccer players divided into three maturational groups regarding the classification of PHV: 42 were Pre; 57 during and 76 post. The tests used were: a) the measurement of the maximum speed of movement during the game; b) vertical jump test: squat jump, countermovement, drop jump, and continuum jump, c) vertical jump test squat jump with evaluation of the strength production: isometric, eccentric, concentric and stability.
Results: Multivariate analysis of the associations of production parameters and strength manifestations with maximum game speed showed that there were different associations as to the maturational groups, which were: the pre-PHV group was moderately association between speed and strength (R2 = 40.48%, p <0.05); in the during-PHV group was with small association, but not significant (R2 = 17.25%, p>0.05); and for the post-PHV group high associations were found between the performances (R2 = 71.40%, p <0.05).
Conclusions: While maximum velocity can be influenced by strength, performance by pre and post peak, there is no influence in the group during PHV.
Key words: Maturity status; peak height velocity, development; strength and speed; young soccer players.

Recibido: 01-12-2019
Aceptado: 30-10-2019
Correspondencia:
Jefferson Espanhol:
E-mail: . [email protected].
Introduction
High intensity performance is a factor that has affected soccer matches. Relevant trends of evolution has been found in this excessive actions2,6,9,12, in the increase of acceleration and explosive plays during the match1,12,17.
The major component associated with those elements is the maximum speed performed in games of young football players1,9,44. The development of maximum speed is known to be non-linear throughout childhood and adolescence37, with the suggestion of an outbreak in puberty (5-9 years) and in adolescence (12-14 years) for boys’ performances41. Particularly in the accomplishment of that velocity, it is observed that the utmost speed in a soccer match is reached faster for U15 (26,5 ± 1,68 km/ h) than U14 (25,4 ± 1,93 km/h, p = 0,022) and U13 (23,5 ± 1,74 km /h, p = 0,001)2.
Research has shown evidences that the increase of muscle strength could result in raise of the acceleration and deceleration capabilities, making soccer players more agile and fast44. Some studies reveal significant connection between the exercise of strength manifestations and the performance of speed variation23,47,48,49. Ergo, reviews contemplate the idea that speed of travel and agility depends on strength output. Therefore, strength is a conditioning competence for the performance of velocity and agility in an athlete.
There is a considerable influence in the period of peak height velocity (PHV) in the performance of maximum speed in young soccer athletes during the execution of sprints40, 42. Growth was observed in groups of pre-PHV to post-PHV when comparing one to the other: there is a better prediction in the accomplishment of maximum speed explained by changes in production of maximum dynamic speed (R2=83%) and in the strength production rate (R2=79%). Those results suggest that the velocity undergoes the influence of the conditioning strength factors organized in maturity groups.
Nevertheless, few researches have been investigating the relation between the pick of growth velocity peak height velocity and the strength output. Thus, in order to optimize the physical performance of the youngsters, information about the changes has been sought, which allows an understanding to the reader of the possible components of trainability between categories29 and maturity36, 37. Also, the estimates of the contributions of the qualitative and quantitative factors in the variation of the performance of the manifestations and productions of the strength can be described.
Starting from this premise, a question arises from what will be the influence of the strength variable on the performance of the maximum speed in a game. The objective of this study was to verify the associations of multiple determinations between the parameters of the performance of the strength production with the maximum speed during a soccer match by maturational levels in soccer players.
Method and Material
Subjects sample:
This study was performed according to the Helsinki ethical issues and the procedures were approved by the Ethics Committee of the Platform Brazil and by Unicamp (Approval of the Committee for ethics in research CAEE78503717.6.0000.5404). All the participants signed form and consent directly with the soccer club. Meanwhile, legal guardians consented for the under age participants by signing form and consent in their name.
Biological maturation was assessed using somatic indicators by the Mirwald et al technique25. This procedure allowed the researchers to calculate the peak height velocity (PHV) transversally. The procedure is based on the interaction between anthropometric variables: body mass, height, sitting height and decimal age. The technique allowed dividing the maturational groups by the period that PHV happens. Participants were divided into three groups based on maturity status indicators: pre-PHV (-3 years and -1 year for PHV); mid- PHV (-1 year for 1 year for PHV) and post-PHV (1 year for 3 years for PHV). One of the inclusion criteria was that the player should have played at least4 matches.
Cross-sectional study with 175 male soccer players participating in the São Paulo soccer championship, divided into three maturational groups: 42 categorized as pre-PHV, 57 as mid-PHV and 76 as post-PHV.
Technical procedures for Variable Measurements:
Maximum speed performance during a soccer play:
The dependent variable was the maximum speed obtained during a soccer match. The speed performance was analyzed during the 2018 season of São Paulo championship, organized by the Paulista Soccer Federation. In addition, competitive phase matches from the Paulista Cup had their performance analyzed. A total of 24 matches of Under-20,Under-17, Under-15 and Under-14 categories (10 matches from each category). The shootings were recorded and stored in a drive for further performance analysis.
The maximum speed performed during a soccer match was comprised at the highest speed during a match; it’s value was expressed in Kilometers per hour (km/h); the match actions speed was measured using the Global Positioning System – GPS (Polar Team2 Pro United States of America – USA)2. The results quality with the GPS procedure allowed measuring with a degree of reliability in repeating measurements, three matches per participant (ICC of 0.811 to 0.901 for both groups ; SEE: 2.13; CV = 1.43% to 3.12%).
Anthropometric measures:
Anthropometric measures of height, and body mass were used to characterize the studied subjects. These measures were taken based on the Lohman standardization27, using the following equipment: a) metal stadiometer with 0.1 cm precision carried out height measures, and b) Plena Lithium Digital electronic scale with 100 grams precision. The trunk – cephalic height was measured from the sitting posture, with the aid of a 50 cm tall wooden bench on which the subject would have his buttocks supported, the trunk and the head in the vertical plane of the stadiometer and the hands resting on the tighs. The neck was slightly stretched to distance the head from the shoulders and the sight axis was horizontal. The same stadiometer was used, in addition, the legs length was obtained through the difference between the trunk-cephalic height and the standing height of the subject.
Performance of strength manifestations:
The explosive strenght performances were estimated using the vertical jump technique. They were evaluated based on the results of vertical jumps5,10,24,52, whose techniques consist on: a) maximum vertical jump starting from a half-squat position without upper limbs interference (SJ), b) maximum vertical jumps with countermovement, starting from half-squat without upper limbs interference (CMJ), c) maximum vertical jumps after a 40 cm heigh drop (DJ), d) continuous maximum vertical jumps in 5 seconds (CJ5s), e) maximum vertical jumps after a 40 cm height drop with fast transition and blast after the fall (DJh/t). The vertical jump height was determined using the JUMP TEST contact platform (Hidrofit Ltda, Belo Horizonte, Minas Gerais, Brasil), The device reports heel height (cm), movement speed, flight time (m.sec.) and contact (m.sec.).
The vertical jump measurements showed to be acceptable with high reliability in the repeated measures at the repeated measures for pre-PHV (CV= 6,2%, ICC=0,93 in SJ; CV= 5,4%, ICC=0,95 in CMJ; CV= 6,1%, ICC=0,89 in DJ; CV=6,8, ICC=0,81 in DJ h/t; CV=7,1%, ICC=0,85 in CJ5s); to mid-PHV (CV= 8,2%, ICC=0,73 in SJ; CV= 7,4%, ICC=0,75 in CMJ; CV= 8,1%, ICC=0,79 in DJ; CV=8,8, ICC=0,71 in DJ h/t; CV=9,1%, ICC=0,75 in CJ5s); and to post-PHV (CV= 4,2%, ICC=0,95 in SJ; CV= 4,9%, ICC=0,96 in CMJ; CV= 5,3%, ICC=0,91 in DJ; CV=5,5%, ICC=0,88 in DJ h/t; CV=6,4%, ICC=0,75 in CJ5s).
Strength production performance parameters:
The strength production variables were evaluated using the following parameters: concentric strength production rate, eccentric strength, isometric strength, coupling strength at explosive movement. The test was performed with the athlete, on a bilateral strength platform with each of his feet on top of its bases. This technique is similar to the execution mode from SJ, however, a 3 seconds coupling phase will be added after the vertical jump. The measurement will be made based on SJ execution method and the strength values are presented on the platform as mean strength values during the isometric stabilization phase; recording the maximum strength produced by the leg extensors during the movement’s eccentric phase by comparing both limbs values (Eccentric Maximum Strength Production) 38,
The values expressed on the platforms; recorded the time of the stability strength (Coupling); value of the strength expressed at the moment of the "coupling time" (going from the eccentric to the concentric phase), will produce the maximum dynamic concentric strength by the SJ vertical jump actions. The vertical jump was executed in two platforms, one for each leg (double strength platform Twin Plates: right and left), analyzed by an ergo system (Ergo System ®, Globus Sport Corporation, Codogne, Italy), registering in Newtons / (N/m), evaluating concentric, eccentric and isometric strength. The results qualityafter this technical procedure was reliable (ICC of 0.75 to 0.88 for both groups, CV = 3.03% to 7.89%).
Statistical Analysis Procedure
Statistical analysis was performed using SPSS 20 (Statistical Package for the Social Sciences), and SigmaPlot 13.0 (Exact Graphs and data analysis). The Kolgorov-Smirnov normality test was used to verify data distribution. The in-class correlation coefficient (ICC), the variation coefficient (VC) and standard error of estimate (SEE) were used to verify the reliability and reproducibility of repeated measures in both vertical jump and speed tests. Descriptive statistics of mean and standard deviation were used to characterize the variables that were studied. Maturational groups differences were verified by ANOVA One Way statistics, followed by Tukey post-hoc analysis for multiple comparisons.
To verify the correlation and the influence of the independent variables on the dependent variable, multiple linear regression was used, applying the coefficient of multiple determination (R2) in each Maturational group. The analysis that enabled a choice of variables, with more intensity with the dependent variable within the maturational groups, stepwise regression analysis was applied, considering the regressive method. The significance level was 5%.
Results
Subjects characteristics
The subject’s characteristics are presented in Table 1, showing mean ±SD values by maturational group. Significant differences were shown between the maturational groups in the variables of age, body mass, age of the PHV (p <0.01), however for the height variable and %G, differences were found by Tukey post-hoc tests for the group pre-PHV in relation to mid-PHV and post-PHV, there were no differences between mid-PHV and post-PHV. The highest maximum speed obtained during a soccer match was observed in post-PHV participants compared to mid-PHV and pre-PHV (Table 1).
Table 1: Body composition of the young soccer players participating in the study
Variables
| PHV
| Anova
|
Pre-PHV
| Mid-PHV
| Post-PHV
|
Age (years)
| 13.42±7.14#ⱡ
| 14.84±0.62
| 16.77±0.61*#
| p<0.01
|
APHV
| 15.28±0.43#ⱡ
| 14.37±0.58
| 13.78±0.38*#
| p<0.01
|
Height (cm)
| 153.86±7.14#ⱡ
| 171.79±5.08
| 177.71±7.06*
| p<0.01
|
BM (kg)
| 48.11±6.42#ⱡ
| 59.39±7.15
| 67.15±6.49*#
| p<0.01
|
% G
| 15.18±1.66#ⱡ
| 13.41±1.67
| 13.68±2.21*
| p<0.01
|
VmaxM
| 21.91±2.56#ⱡ
| 29.77±2.16
| 32.22±1.79*#
| p<0.01
|
| | | | | | |
Legend: PHV = Peak Height Velocity; APHV: Age Peak Height Velocity; BM: Body Mass; VmaxM: Velocity maximum Match; Tukey post hoc tests; significant differences (p <0.05) between maturational groups in relation to Pre-PHV (*); Mid-PHV (#); Post-PHV (ⱡ).
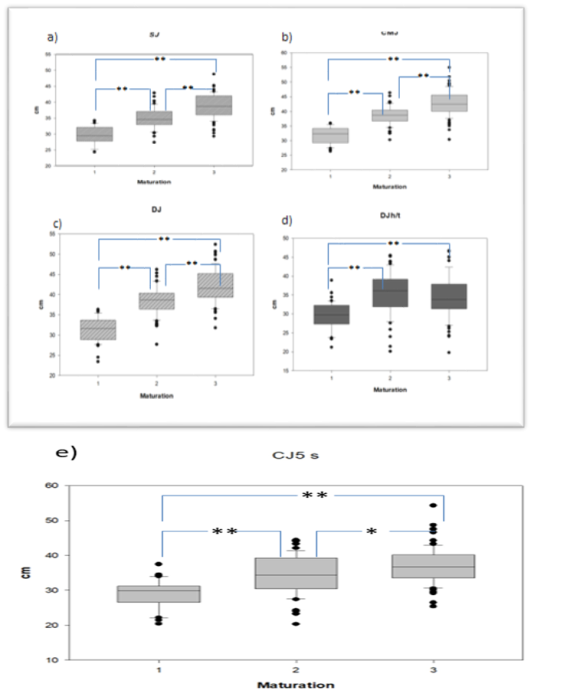
Figure 1: Comparison of the parameters of the explosive strength manifestations: a) neural component (SJ); b) elastic component (CMJ); c) stretch speed component (DJ); d) reflex component (DJ h / t); e) reactive stiffness component (CJ 5s). indicates group differences * (p <0.05) and ** (p <0.01).
Performance of strength manifestation
This study results revealed that the three maturational groups differed in performance of strength manifestations, estimated in SJ vertical jumping techniques (F = 118.069, p < 0.01), CMJ (F = 106.28, p < 0.01), DJ (F = 15.19, p < 0.01), DJ h/t (F = 116.02, p < 0.01), and CJ5s (F = 35.48, p < 0.01).
As shown in figure 1, the post hoc comparison observed significant differences between Pré-PHV, Mid-PHV and Post- PHV, for four variables of strength estimation: SJ, CMJ, DJ and CJ5s. However, no differences were observed between during and after Mid-PHV versus DJ h/ t, in contrast to Pré-PHV compared to Mid-PHV and Post-PHV that differed significantly between both groups.
When comparing the performance of the strength manifestation estimated by the jumping techniques, lower yields were observed in Pre-PHV participants for all parameters compared to the other maturational groups, revealing greater differences in Post- PHV performance.
Strength production performance
All performance of the strength production parameters were showed significant differences between the three maturational groups (Figure 2), in relation to the rate of strength production (F = 171.87; p <0.01), eccentric strength (F = 74.05; <0.01), isometric strength (F = 104.52, p <0.01) and coupling (F = 30.15, p <0.01). The results revealed higher performance for the Post-PHV group than for Pre-PHV and Mid-PHV.
Association of performances
Multivariate analysis of the associations of production parameters and strength manifestations with maximum game speed showed three clear trends (Table 2). The results presented significant coefficients of determination for Pre- PHV and Post-PHV (p <0.05), revealing the main components of coupling and CMJ, respectively for Pre- PHV and Post-PHV. However, no significant coefficients were demonstrated for the maturity status of Mid-PHV.
Relation between speed and strength in the Pre-PHV
The maximum speed performance during a soccer match showed negative relation with coupling (r = -0.738; p <0.05). However, no significant correlations were found with the other strength variables. The relation between strengths showed significant positive correlations between all manifestations of strength, as well as between the parameters of strength production. However, significant negative correlations were observed between strength productions and coupling (Table 3). There were no significant correlations between the strength production and the strength manifestation.
Figure 2: Comparison of the parameters of strength production: a) rate of strength production; b) Eccentric strength; c) Isometric strength; d) Coupling; indicates group differences *(p <0.05) and **(p <0.01).
Table 2: Association between maximum speed and strength production in young soccer players in different maturation groups
Independent
Variables
|
| Dependent Variable Maximum speed obtained during a soccer match
|
Pre-PHV
| Mid-PHV
| Post-PHV
|
Multiple Determination Coeficient (R2)
|
| 0.405
| 0.172
| 0.714
|
Standard Error QM
|
| 6.12
| 8.09
| 2.54
|
Principal Component
|
| Coupling
| CJ5s
| CMJ
|
p
|
| 0.039
| 0.082
| 0.012
|
Multiple Correlation Coeficient (R)
|
| 0.6362
| 0.385
| 0.845
|
| | | | |
Legend: PHV = Peak Height Velocity;
Table 3: Correlation coefficient between variables in the Pre-PHV
Variables
| VmaxM
| SJ
| CMJ
| DJ
| DJ h/t
| C5s
| RSF
| ES
| IS
| C
|
VmaxM
| 1
| ---
| ---
| ---
| ---
| ---
| ---
| ---
| ---
| ---
|
SJ
| 0.162
| 1
| ---
| ---
| ---
| ---
| ---
| ---
| ---
| ---
|
CMJ
| 0.162
| 0.821*
| 1
| ---
| ---
| ---
| ---
| ---
| ---
| ---
|
DJ
| 0.351
| 0.725*
| 0.774*
| 1
| ---
| ---
| ---
| ---
| ---
| ---
|
DJ h/t
| 0.158
| 0.696*
| 0.619*
| 0.785*
| 1
| ---
| ---
| ---
| ---
| ---
|
C5s
| -0.040
| 0.669*
| 0.553*
| 0.667*
| 0.882*
| 1
| ---
| ---
| ---
| ---
|
RSF
| -0.123
| -0.102
| -0.151
| -0.178
| -0.090
| -0.009
| 1
| ---
| ---
| ---
|
ES
| -0.079
| -0.211
| -0.175
| -0.145
| -0.185
| -0.020
| 0.709*
| 1
| ---
| ---
|
IS
| 0.079
| -0.06
| -0.037
| -0.010
| -0.039
| -0.012
| 0.619*
| 0.692*
| 1
| ---
|
C
| -0.738*
| 0.012
| -0.089
| -0.042
| -0.117
| -0.079
| -0.581*
| -0.627*
| -0.711*
| 1
|
| | | | | | | | | | |
Legend: *p<0.05; VmaxM: Velocity maximum Match; SJ: Squat Jump; CMJ: Countermovement Jump; DJ: Drop Jump; DJ h / t: Drop Jump high / time; CJ5s: continuum Jump five seconds; RSF: rate of strength production; ES: eccentric strength; IS: isometric strength; C: coupling.
Relation between speed and strength in the Mid-PHV
Significant positive relations were observed between the maximum speed during a soccer match with the vertical jump technique CJ5s (r = 0.640; p <0.05). However, no significant correlations were found with the other strength variables.
The relation between strengths, significant positive correlations were observed between some strength manifestations, as between some of the parameters of strength production; (r = 0.760, p <0.05), DJ x DJ h / t (r = 0.677, p<0.05) = P<0.05), DJh / t (r = 0.911, p <0.05), DJ x CJ5s (r = 0.529, p <0.05). For the strength production parameters, relations between strength production and eccentric strength (r = 0.503, p <0.05), isometric and eccentric strength (r = 0.700, p <0.05), eccentric strength and coupling r = 0.566, p <0.05), and isometric strength x coupling (r = 0.490, p <0.05). There were no other significant correlations (p> 0.05) between the strength variables (Table 4).
Relation between speed and strength in the Post-PHV
Significant positive relations were observed in the Post-PHV group between speed and all strength variables. Significant positive relations were observed between the strength manifestations and between the parameters of strength production, as between both (Table 5). However, significant negative relations were observed between the coupling parameter and the vertical jump technique variables in the strength estimation.
Table 4: Correlation between variables coefficient in the Mid-PHV group
Variables
| VmaxM
| SJ
| CMJ
| DJ
| DJ h/t
| CJ5s
| RSF
| ES
| IS
| C
|
VmaxM
| 1
| ---
| ---
| ---
| ---
| ---
| ---
| ---
| ---
| ---
|
SJ
| -.183
| 1
| ---
| ---
| ---
| ---
| ---
| ---
| ---
| ---
|
CMJ
| -.192
| 0.818*
| 1
| ---
| ---
| ---
| ---
| ---
| ---
| ---
|
DJ
| -.159
| 0.677*
| 0.760*
| 1
| ---
| ---
| ---
| ---
| ---
| ---
|
DJ h/t
| -.195
| 0.316
| 0.402
| 0.582*
| 1
| ---
| ---
| ---
| ---
| ---
|
CJ5s
| 0.640*
| 0.301
| 0.399
| 0.529*
| 0.911*
| 1
| ---
| ---
| ---
| ---
|
RSF
| -.195
| 0.125
| 0.013
| -.024
| 0.088
| 0.084
| 1
| ---
| ---
| ---
|
ES
| 0.097
| 0.086
| -.113
| -0.019
| 0.043
| -.047
| 0.503*
| 1
| ---
| ---
|
IS
| -.006
| 0.030
| -.188
| -0.093
| -.122
| -0.083
| 0.477
| 0.700*
| 1
| ---
|
C
| -,122
| 0,108
| -,272
| -0,147
| -0,069
| -,094
| 0,151
| 0.566*
| 0.490*
| 1
|
| | | | | | | | | | |
Legend: *p <0.05; VmaxM: Velocity maximum Match; SJ: Squat Jump; CMJ: Countermovement Jump; DJ: Drop Jump; DJ h / t: Drop Jump high / time; CJ5s: continuum Jump five seconds; RSF: rate of strength production; ES: eccentric strength; IS: isometric strength; C: coupling.
Table 5: Correlation coefficient between variables in the Post-PHV
Variables
| VmaxM
| SJ
| CMJ
| DJ
| DJ h/t
| C5s
| RSF
| ES
| IS
| C
|
VmaxM
| 1
|
| ---
| ---
| ---
| ---
| ---
| ---
| ---
| ---
|
SJ
| 0.737*
| 1
| ---
| ---
| ---
| ---
| ---
| ---
| ---
| ---
|
CMJ
| 0.920*
| 0.927*
| 1
| ---
| ---
| ---
| ---
| ---
| ---
| ---
|
DJ
| 0.815*
| 0.902*
| 0.901*
| 1
| ---
| ---
| ---
| ---
| ---
| ---
|
DJ h/t
| 0.810*
| 0.904*
| 0.845*
| 0.953*
| 1
| ---
| ---
| ---
| ---
| ---
|
C5s
| 0.819*
| 0.920*
| 0.843*
| 0.941*
| 0.986*
| 1
| ---
| ---
| ---
| ---
|
RSF
| 0.554*
| 0.805*
| 0.894*
| 0.878*
| 0.788*
| 0.749*
| 1
| ---
| ---
| ---
|
ES
| 0.608*
| 0.834*
| 0.808*
| 0.723*
| 0.738*
| 0.761*
| 0.829*
| 1
| ---
| ---
|
IS
| 0.641*
| 0.873*
| 0.775*
| 0.744*
| 0.714*
| 0.724*
| 0.869*
| 0.861*
| 1
| ---
|
C
| -0.675*
| -0.764*
| -0.721*
| -0.791*
| -0.742*
| -0.733*
| -0.828*
| -0.908*
| -0.957*
| 1
|
| | | | | | | | | | |
Legend: *p <0.05; VmaxM: Velocity maximum Match; SJ: Squat Jump; CMJ: Countermovement Jump; DJ: Drop Jump; DJ h / t: Drop Jump high / time; CJ5s: continuum Jump five seconds; RSF: rate of strength production; ES: eccentric strength; IS: isometric strength; C: coupling.
Discussion
The main discovery of the present study was that the variation in the statistics of the maximum speed performances, obtained during a football match with young players, is detailed by a combination of parameters of the strength production and some strength manifestation’s estimates measured by vertical jump tests inside the protocol of somatic maturation.
In comparing maturational groups, significant differences were perceived, mainly about the maximum speed attained in a soccer match, and the performances of strength, both in the one estimated by manifestations of strength as in the one dimensioned by strength production’s parameters. This revealed that the Post-PHV group exhibit superior performance in comparison to others. Growth of maturation has reflected in substantial rise in strength and speed performance in all groups – this was reported also in some other researches 32,34,35,40,42,44.
Analysis has shown three different tendencies about how the trend behaves on the determination of strength influence in the maximum speed during a match in distinct maturational groups. In the first course, the strength attributes have a moderate weight in speed performance for the Pre-PHV group. In the second trend, strength had a minor determination on the speed in the group in Mid-PHV, yet it was not significant. Ultimately, in the third trend, there was a distinguished variable with major influence upon the speed by the strength in the Post-PHV group.
Influence of strength performance in the speed to Pre-PHV group.
Results of multiple regression have indicated significant explanation of 40,48% (Multiple Determination Coeficient, R2=0.4048) of the strength generation performance and its manifestations in vertical jump tests, that predicts influences upon speed in soccer matches on Pre-PHV group. The strength behavior explained some variations from the motion to stabilization of the movement, which was the primary predictor of velocity performance.
This may reflect the more dynamic nature of these tasks, especially in the case of the maximum speed of movement during the game, and causes a greater need for unilateral stabilization skills and mechanisms of equilibrium movement to efficiently perform shifts in agility movements, accelerations and running speed1,35,44. Interestingly, the stability of the motion contributed to explain the variation in the performance of the maximum velocity during the start in the Pre-PHV group. It appears that these youngsters in the present study may not have the necessary motor coordination and strength to effectively guide, stabilize and apply strength through their lower limbs16,35.
The results have indicated that somatic maturation still have some relevance, although being small or moderate, in explaining the fluctuation associated both in the strength generation to optimize maximum speed during a match, as well as to increase its power through the manifestations of strength. Therefore, suggesting that the performance in both of them related to the maturational status4,44.
This notion is also portrays in the high to moderate connexion (r=0,553 a 0,882; p<0,05) between the vertical jump techniques, such as strength output (r=-0,581 a 0,711, p<0,05), which suggests that different neuromuscular qualities for squatting and jumping31,32,33,34,35 are required both to potentiate jump heights31 and to stabilize movement independently [35].
This study has shown that selected vertical jump tests can explain a part of the variation on the speed performance in young soccer Mid-PHV. Such variation is cognized in low speed and strength performances in boys who approach PHV caused by problems in motor coordination19,44,51. That is, they require age-related neuromuscular adaptations for the function of cycle stretching and shortening28,31, specifically, enhanced levels of pre-activation of eccentric strength in the concentric phase of vertical jump38, and musculotendine stiffness28.
Influence on strength performance in speed to the group Mid-PVC
Analysis upon multiple regression did not revealed substantial influence in strength performance, under the maximum speed in a soccer match for the group Mid-PHV. The results conclude that there is an interesting phenomenon occurring during PVC: there were significant differences in the performance of the maximum speed during a match in this maturational group. However, it has found low influences of determination of the production and manifestation of strength associated with the changes of the maximum speed during a game in young soccer players.
A possible explanation for this phenomenon existence is that there is periods of morphological, neurological, hormonal and muscle adaptations in young players. That can be associated to a time of biological settings, which provides low relevance in strength performance on speed and reflects in a non-linear performance of children and adolescents36,37.
Some links within the strength manifestations estimated by vertical jump techniques, found by this study, are related to the proximal components, such as: the relation of SJ with CMJ; CMJ with DJ; DJ com DJh/t and CJ5 seg, DJh/t with CJ5seg. On the other hand, in the production of strength, significant relations were found between the rate of strength output with eccentric strength, isometric strength with itself, and isometric strength with stability strength.
This finding is associated with periods of sensivity and specificity20 in some components of production, after this stage changes occur in its development. One of the characteristics presented in this period is the possibility of a temporary interruption in the performance of motor control3,51,53. This may determine that the phenomenon is associated with the increase of the accelerated body size, the height and the length of lower limbs]. 31,40,41
Such changes concerning physical growth would be expected, as part of a natural rise and development36,37. Consequently, that may have been temporarily restricted, as players adjusted to perform motor skills with longer limbs21, 45.
Increases in velocity performance are more likely attributed to changes in tendon muscle characteristics during maturation, especially in this group Pre-PHV (ie at the time of growth spurt). This may include modifications relevant to increase cross-sectional area of muscle39,46, fascicle lengths25,26, muscle-tendon junction size29 and stiffness47, adjustments in muscle balance in the relationship between contraction of the agonist-antagonist muscles15, adaptations of the pre-activation of both the eccentric strength in the concentric phase of the vertical jump38 and the increase in recruitment of motor units21,22,29,38, and speed of contraction30, adaptations in the elastic properties of the tendon25,26, and age-related increases in tendon muscle rigidity28 are in perios of adaptation due to changes in body dimensions.
Analysis in multiple regression revealed that CJ5seg was the main predictor of the variance in maximum speed performance during a football match. The results suggested that the manifestation of strength presents a certain degree dependent on maturity; these changes are attributable to development and learning, and modifications as a consequence of growth and development processes19, as well as in the great stability adjustments in vertical jumping movements13, in which jumps52 are more representative in the fast elongation and shortening cycle activities due to their need for pre-activation, use of stored elastic energy, neuromuscular potentiation29, and stretch reflex mechanism26,50.
Influence in strength performance on speed to Post-PHV group.
Specifically, it can be considered that maturation was the strongest predictor of maximum speed performance during a match, while strength performance explained the greater amount of Post-PHV variation in both strength production and performance demonstration of the estimated strength in vertical jumps tests.
It may be suggested that maturation was found to explain the greater variation in strength performance in the performance of velocity, may simply reflect the hormonal changes44,46,55, and consequent adaptations in muscle size and function influenced by maturity44,46,55, as adaptations of other neural components14,29, elastic25,47, elastic/reflex31,32,33, of the complex muscle tendon and stiffness28,31, but they also influenced by the strength production that stabilize the coupling, to generate a higher rate produced with a certain power (rate of strength production) with certain safety in the explosive actions35, both to increase the eccentric potentiated strength of the muscles and the isometric one that support the muscle tendon complex.
This suggests that the period immediately following the peak velocity of height seems to be a naturally occurring accelerated development phase and may be an opportune time to improve physical performance33.
Results show an excellent determination of the performance of the strength parameters and the indicators of the strength manifestations estimated by the jumping techniques on the speed, suggesting the influence of the strength in the improvement of the velocity related to the maturity observed in the Post-PHV period [14], that may facilitate improved technical efficiency and strength application during commuting, resulting in greater speed in young soccer players after PHV.
Limitations
A limitation of this study was the procedure used to delineate the division of maturational groups, with a 1-year interval, before and after the largest growth spurt (± 1 year). Another limitation was the impossibility of controlling the factors that interfered in soccer matches. In addition, the generalization was restricted, for all the participants were male and pro soccer players.
Future studies will be necessary for a methodological outline that can make use of maturational groups with a shorter time of peak height velocity, using feminine sex in sample participation, as well as soccer players with qualification of different competitive levels: amateur and recreationist. Further research would be essential in order to evaluate the influence of body composition, bone mass on maximal velocity performance during a match in young soccer players throughout maturation, which could provide further evidence on how best to improve these capabilities.
As this study has demonstrated, there is evidence that the maximum speed performance during a football match is directly influenced by the status of maturity, whose impacts may be considered as a determinant factor in the strength performances’ capacities in Pre-PHV and Post-PHV, however not in the Mid-PHV group.
The results indicate that the productions parameters and strength manifestations are decisive in the maturity status in young soccer players during periods of Pre-PHV and Post-PHV, yet they may not discern in during-PVC period. Notably, Pre-PHV groups had moderate relations in the strength performance, although isolated between strength production and its manifestations; Mid-PHV group had a low link, with some sparse relations between variables of strength in seclusion; also Post-PHV group was associated with considerable high relation for strength performance.
References
- Al Haddad H, Simpson BM, Buchheit M, Di Salvo V, Mendez-Villanueva A. Peak match speed and maximal sprinting speed in young soccer players: effect of age and playing position. Int J Sports Physiol Perform 2015;10(7):888-96.
- Atan AS, Foskett A, Ali A. Motion Analysis of Match Play in New Zealand U13 to U15 Age-Group Soccer Players. J Strength Cond Res 2016 Sep;30(9):2416-23.
- Beunen G, Malina RM, Growth and physical performance relative to the timing of the adolescent spurt. Exerc Sport Sci Rev 1988;16:503-40.
- Bidaurrazaga-Letona I, Lekue JA, Amado M, Gil SM. Does a one-year age gap modify the influence of age, maturation and anthropometric parameters as determinants of performance among youth elite soccer players? J Strength Cond Res 2017;22.
- Bosco C. La valoración de la fuerza con el teste de Bosco. Barcelona: Paidotribo; 1994.
- Bush M, Barnes C, Archer DT, Hogg B, Bradley PS. Evolution of match performance parameters for various playing positions in the English Premier League. Hum Mov Sci 2015; 39:1-11.
- Buchheit M, Simpson BM, Mendez-Villanueva A. Repeated High-Speed Activities during Youth Soccer Games in Relation to Changes in Maximal Sprinting and Aerobic Speeds. Int J Sports Med 2013; 34(1):40-43.
- Carling C, Dupont G. Are declines in physical performance associated with a reduction in skill-related performance during professional soccer match-play? J Sports Sci 2011;29(1):63–71.
- Carling C, Bradley P, McCall A, Dupont G. Match-to-match variability in high-speed running activity in a professional soccer team. J Sports Sci 2016;34(24):2215-2223.
- Dalleau G, Belli A, Viale F, Lacour JR, Bourdin M. A simple method for field measurements of leg stiffness in hopping. Int J Sports Med 2004; 25:170-176.
- Deprez D, Valete-dos-Santos J, Lenoir M, Philippaerts R, Vaeyens R. Longitudinal Development of Explosive Leg Power from Childhood to Adulthood in Soccer Players. Int J Sports Med 2015;36(8):672-9.
- Fessi MS, Zarrouk N, Di Salvo V, Filleti C, Barker AR, Moalla W. Effects of tapering on physical match activities in professional soccer players. J Sports Sci 2016;34(24):2189-2194.
- Flanagan EP, Ebben WP, Jensen RL. Reliability of the reactive strength index and time to stabilization during depth jumps. J Strength Cond Res 2008; 22(5):1677-1682.
- Forbes H, Bullers A, Lovell A, McNaughton LR, Polman RC, Siegler JC. Relative torque profiles of elite male youth footballers: effects of age and pubertal development. Int J Sports Med 2009; 30(8):592–597.
- Frost G, Dowling J, Dyson K, Bar-Or O. Co-contraction in three age groups of children during treadmill locomotion J Elect Kinesiol 1999;7(3):179–186.
- Giminiani RD, Visca C. Explosive strength and endurance adaptations in young elite soccer players during two soccer seasons. Plos One 2017; 12(2): 1-17.
- Goto H, Morris JG, Nevill ME. Motion analysis of U11 to U16 elite English Premier League Academy players. J Sports Sci 2015;33(12):1248-58.
- Hammami R, Chaouachi A, Makhlouf I, Granacher U, Behm DG. Associations Between Balance and Muscle Strength, Power Performance in Male Youth Athletes of Different Maturity Status. Pediatr Exerc Sci 2016; 28(4):521-534.
- Harrison AJ, Gaffney S. Motor development and gender effects on stretch shortening cycle performance. J Sci Med Sport 2001;4(4): 406-415.
- Hespanhol JE, Arruda M, Bolaños MAC, Silva RLP. Sensitivity and specificity of the strength performance diagnostic by different vertical jump tests in soccer and volleyball at puberty. Rev Bras Med Esporte 2013;19(5):367-370.
- Hewett TE, Myer GD, Ford KR. Decrease in neuromuscular control about the knee with maturation in female athletes. J Bone Surgery 2004;86,1601-1608.
- Hortobágyi T, DeVita P. Muscle pre- and coactivity during downward stepping are associated with leg stiffness in aging. J Elect Kinesiol 2000; 10:117–126.
- Koklu Y, Sert O, Alemdaroglu U, Arslan Y, Comparison of the physiological responses and time-motion characteristics of young soccer players in small-sided games: the effect of goalkeeper. J Strength Cond Res 2015; 29(4):964-71.
- Komi PV, Bosco C. Utilization of stored elastic energy in leg extensor muscles by men. Med Sci Sports Exerc 1978;10(14):261-265.
- Kubo K, Kanehisa H, Kawakami Y, Fukanaga T. Growth changes in the elastic properties of human tendon structures. Int J Sports Med 2001; 22:138–143, 2001.
- Kubo K, Morimoto M, Komuro T, Tsunoda N, Kanehisa H, Fukunaga T. Influences of tendon stiffness, joint stiffness, and electromyographic activity on jump performance using single joint. Eur J Appl Physiol 2007;99: 235-243.
- Lohman TG, Roche AF, Martorell R. Anthropometric standardization reference manual. Champaign: Human Kinetics; 1988.
- Lambertz D, Mora I, Grosset JF, Perot C. Evaluation of musculotendinous stiffness in prepubertal children and adults, taking into account 17 muscle activity. J Appl Physiol 2003; 95:64-72.
- Lazaridis S, Bassa E, Patikas D, Giakas G, Gollhofer A, Kotzamanidis C. Neuromuscular differences between prepubescents boys and 20 adult men during drop jump. Eur J Appl Physiol 2010:110(1):67-74.
- Lin JP, Brown JK, Walsh EG. Soleus muscle length, stretch reflex excitability, and the contractile properties in children and adults: a study of the functional joint angle. Dev Med Child Neurol 1997;39(7): 469–480.
- Lloyd RS, Oliver JL, Hughes MG, Williams CA. Reliability and validity of field-based measures of leg stiffness. J Sports Sci 2009;27:1565-1573.
- [loyd RS, Oliver J, Hughes MG, Williams CA. The influence of chronological age on periods of accelerated adaptation of stretch-shortening cycle performance in pre and post pubescent boys. J Strength Cond Res 2011;25(7):1889–97.
- loyd RS, Oliver J, The youth physical development model: A new approach to long-term athletic development. Strength Cond J 2012; 34:61–72.
- Lloyd RS, Oliver JL, Hughes MG, Williams CA. Age-related differences in the neural regulation of stretch-shortening cycle activities in male 5 youths during maximal and sub-maximal hopping. J Elect Kinesiol 2012; 22(1):37-43.
- Lloyd RS, Oliver JL, Radnor JM, Rhodes BC. Faigenbaum AD, Myer GD. Relationships between functional movement screen scores, maturation and physical performance in young soccer players. J Sports Sci 2015 33(1): 11-19.
- Malina RM, Eisenmann JC, Cumming SP, Ribeiro B, Aroso J. Maturity-associated variation in the growth and functional capacities of youth football (soccer) players 13–15 years. Eur J Appl Physiol 2004;91(5-6):555–62.
- Malina RM, Rogol AD, Cumming SP, Coelho e Silva MJ, Figueiredo AJ. Biological maturation of youth athletes: assessment and implications. Br J Sports Med 2015;49(13):852-9.
- McBride JM, McCaulley GO, Cormie P. Influence of preactivity and eccentric muscle activity on concentric performance during vertical jumping. J Strength Cond Res 2008; 22(3): 750-757.
- Meylan, C.M.P, Cronin, J.B., Oliver, J.L., Hopkins, W.G. and Contreras, B. 1 The effect of maturation on adaptations to strength training and detraining in 11–2 15-year-olds. Scand J Med Sci Sports 2014 Jun;24(3):156-64.
- Meyers RW, Oliver J, Hughes MG, Cronin J, Lloyd RS. Maximal sprint speed in boys of increasing maturity. Pediatr Exerc Sci 2015; 27:85–94.
- Meyers RW, Oliver J, Hughes M, Lloyd RS, Cronin JB. The influence of maturation on sprint performance in boys over a 21-month period. Med Sci Sports Exerc 2016; 48(12): 2555-2562.
- Meyers RW, Oliver J, Hughes M, Lloyd RS, Cronin JB. Influence of age, maturity, and body size on the spatiotemporal determinants of maximal sprint speed in boys. J Strength Cond Res 2017;31(4):1009-1016.
- Mirwald RL, Baxter-Jones DA, Beunen GP. An assessment of maturity from anthropometric measurement. Med Sci Sports Exerc 2002; 34:689-694.
- Murtagh GH, Brownlee TE, O’boyle A, Morgans R, Drust B, Erskine RM. Importance of Speed and Power in Elite Youth Soccer Depends on Maturation Status. J Strength Cond Res 2018;32(2): 297-303.
- Myer GD, Jayanthi N, Difiori JP, Faigenbaum AD, Kiefer AW, Logerstedt D, Micheli LJ. Sport Specialization, Part I: Does Early Sports Specialization Increase Negative Outcomes and Reduce the Opportunity for Success in Young Athletes? Sports Health 2015;5(5):437-442.
- Ramos E, Frontera WR, Llopart A, Feliciano D. Muscle strength and hormonal levels in adolescents: Gender related differences. Int J Sports Med 1998; 4 19(8):526–531.
- Rumpf MC, Cronin JB, Oliver J, Hughes MG. Kinematics and kinetics of maximum running speed in youth across maturity. Pediatr Exerc Sci 2015;27(5):277–84.
- Rodriguez-Rossell D, Mora-Custodio R, Márquez FF, Yánez-Garcia JM, Gonzalez-Badillo JJ. Traditional vs. sport-specific vertical jump tests: reliability, validity and relationship with the legs strength and sprint performance in adult and teen soccer and basketball players. J Strength Cond Res 2017;31(1): 196-206.
- Selmi MA, Al-Haddabi B, Yahmed, MH, Sassi RH. Does maturity status affect the relationship between anaerobic speed reserve and multiple sprints sets performance in young soccer players? J Strength Cond Res 2017;29.
- Padua DA, Arnold BL, Perrin DH, Gansneders BM, Carcia CR, Granata KP. Fatigue, vertical leg stiffness, and stiffness control strategies in males and females. J Athletic Training 2006; 41(3): 294-304.
- Philippaerts RM, Vaeyens R, Janssens M, Renterghem B V, Matthys D, Craen R, Bourgois J, Vrijens J, Beunen G, Malina RM. The relationship between peak height velocity and physical performance in youth soccer players. J Sports Sci 2006;24: 221–230.
- Quagliarella L, Sasanelli N, Belgiovine G, Accettura D, Notarnicola A, Moretti B. Evaluation of counter movement jump parameters in young male soccer players. J Appl Biomater Biomech. 2011; 9:40-6.
- Quatman CE, Ford KR, Myer GD, Hewett TE. Maturation leads to gender differences in landing strength and vertical jump performance. The American J Sports Med 2006;34(5):806-813.
- Yague PH, De La Fuente JM. Changes in height and motor performance relative to peak height velocity: A mixed-longitudinal study of Spanish boys and girls. Am J Hum Biol. 1998;10: 647-660.
- Vanttinen T, Blomqvis M, Nyman K, Hakkinrn K. Changes in body composition, hormonal status, and physical fitness in 11-13, and 15-year-old Finnish regional youth soccer players during a two-year follow-up. J Strength Cond Res 2011;25(12):3342-51.
Conflict of interest: The authors state that they do not present any conflict of interest for this paper.
Financing: Self-financed